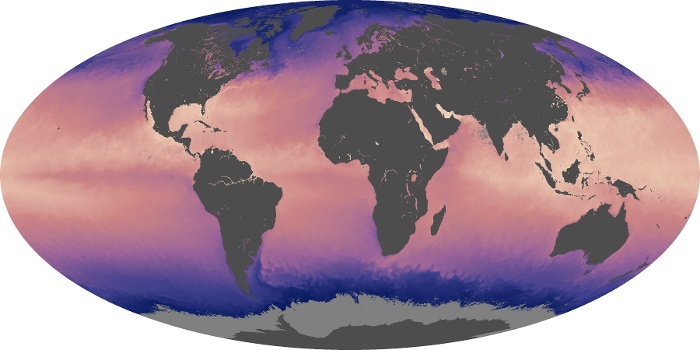
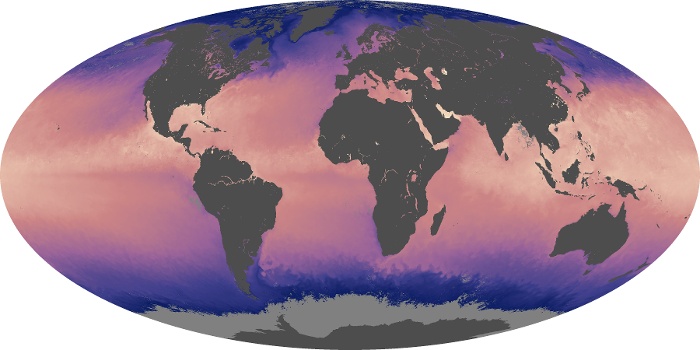
In ONLY 15 years the hotter ocean waters have reached further into polar regions and intensified at the equator.
The most obvious pattern (click here) shown in the time series is the year-round difference in sea surface temperatures between equatorial regions and the poles. Various warm and cool currents stand out even in monthly averages of sea surface temperature. A band of warm waters snakes up the East Coast of the United States and veers across the North Atlantic the Gulf Stream....
Maps of July 2002 is above and the map of July 2016 is below.