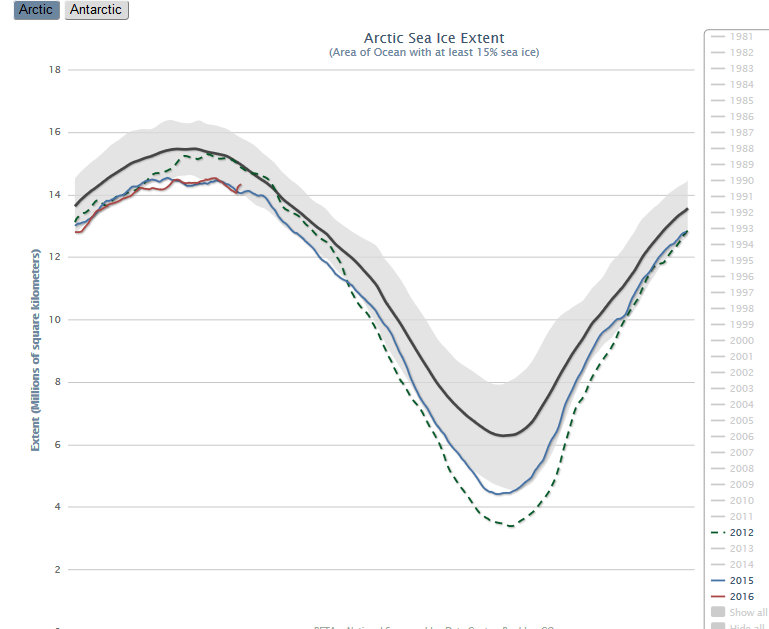
It is an interactive that allows for any or all years to be presented on the graph. The top dark solid line shows the average for most of the years.
The blue line is 2015.
The dotted green line is 2012.
And in the upper left corner is the beginning of the measure of 2016.
The north pole is the ice ocean, the Arctic Ocean. The sea ice is an indication of the vitality of the ocean. The ice structures of Earth is how the planet mitigates heat.
Updated December 11, 2015
Sea ice grows throughout the winter (click here) and melts throughout the summer, reaching its maximum extent in late February or March, and its minimum extent in September. The ice that survives at least one summer melt season is typically thicker and more likely to survive future summers. Since the 1980s, the amount of this perennial ice (or multiyear) has declined dramatically.
This animation tracks the relative amount of ice of different ages each week from 1990 through early November 2015. The first age class on the scale (1, darkest blue) means "first-year ice,” which formed in the most recent winter. The oldest ice (>9, white) is ice that is more than nine years old. Dark gray areas indicate open water or coastal regions where the spatial resolution of the data is coarser than the land map....