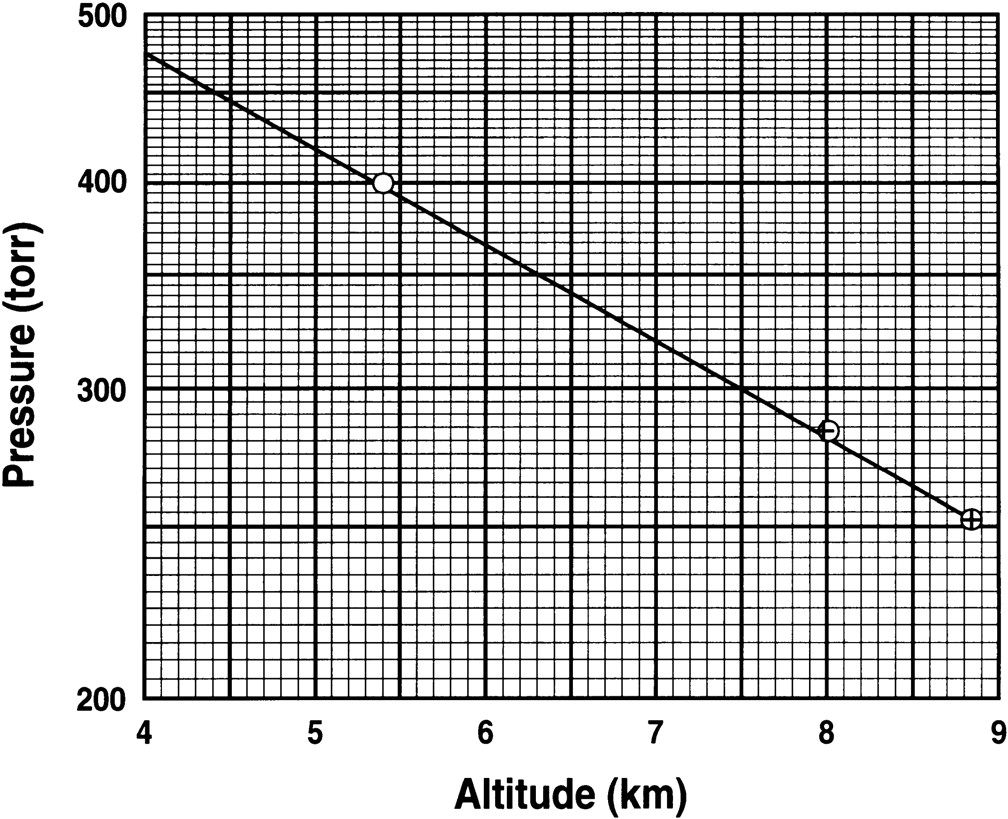
The altitude is across the 'X'/horizontal/bottom axis/line.
The pressure is along the 'Y'/vertical/up and down axis/line.
As the chart moves from left to right, the altitude increases. In then reading the pressures as the altitude goes up, the pressures come down.
